Robert Lehmann
Planet-Scale Dashboards
#1about 3 minutes
The challenge of creating monitoring dashboards from scratch
Monitoring is often an afterthought, leading to painful incident response without the necessary dashboards for troubleshooting.
#2about 3 minutes
Understanding Google's unique observability scaling challenges
Google's massive scale, global distribution, and monorepo architecture created a unique need for a scalable, reusable monitoring solution.
#3about 5 minutes
Building reusable dashboards with templated dimensions
Replace hardcoded values in queries with template variables, called dimensions, to create a single dashboard that can be reused for any service.
#4about 6 minutes
Solving dashboard discovery with scopes and traits
Address the problem of too many dashboards by having users select a "scope" (e.g., a service), which then uses discovered "traits" to show only relevant dashboards.
#5about 2 minutes
Modeling different entities with scope types
Introduce "scope types" to create namespaces for different kinds of monitorable entities, such as servers, databases, or machine learning models.
#6about 4 minutes
Why infrastructure as code is not the right solution
Static provisioning with infrastructure-as-code or dashboards-as-code is insufficient because it lacks dynamic runtime information and creates a stale second source of truth.
#7about 3 minutes
Improving performance at scale with query variants
Use pre-aggregated metrics and define multiple query "variants" within a graph, allowing the system to automatically select the most performant query based on the user's drill-down level.
#8about 1 minute
Visualizing dependencies with a service graph
Leverage the scope and dependency information to build a service graph that helps engineers quickly navigate between related systems during an incident.
#9about 1 minute
Key takeaways for building planet-scale dashboards
A summary of the core principles: use dimensions for reusability, traits for discovery, scope types for genericity, and variants for performance.
Related jobs
Jobs that call for the skills explored in this talk.
Matching moments
02:21 MIN
Adopting an "as code" approach for dashboards
Monitoring as Code - Managing your dashboards at scale
06:29 MIN
Overcoming observability challenges with a unified platform
All your telemetry data from any source in one place
05:35 MIN
Moving from basic monitoring to full system observability
All your telemetry data from any source in one place
01:40 MIN
How engineers handle production errors and monitoring
DevOps at Netflix
01:31 MIN
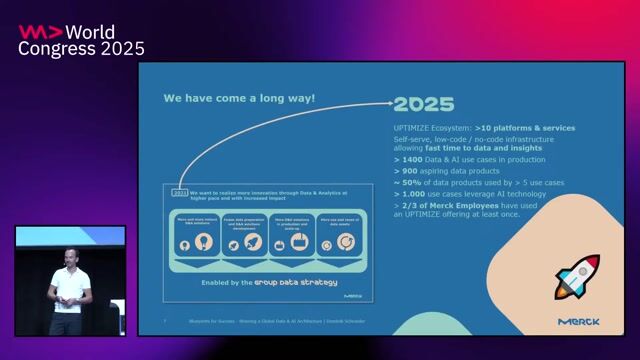
Addressing the challenges of scaling a global data platform
Blueprints for Success: Steering a Global Data & AI Architecture
04:17 MIN
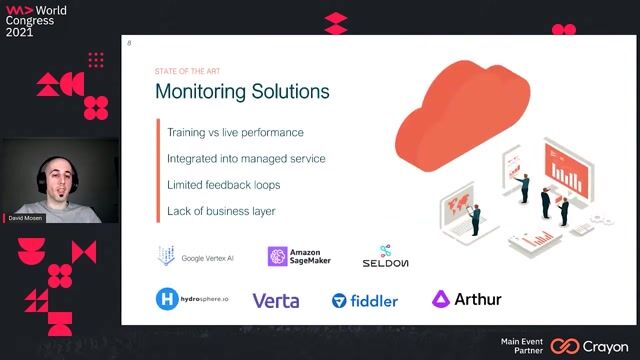
Evaluating the state of current monitoring solutions
Deployed ML models need your feedback too

04:30 MIN
Building a cost-effective hybrid observability platform
Software Engineering Social Connection: Yubo’s lean approach to scaling an 80M-user infrastructure
03:48 MIN
Navigating the overwhelming explosion of observability tools
Telemetry without the 'Tool Tax'
Featured Partners
Related Videos
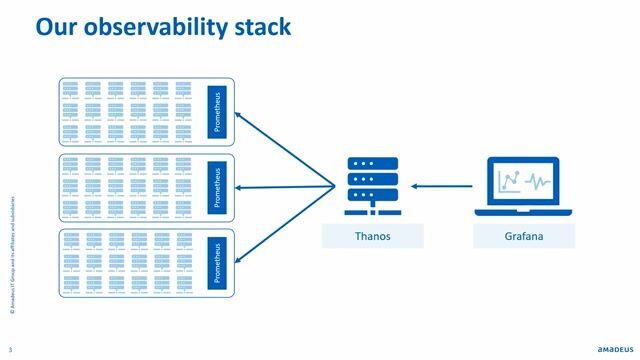 32:47
32:47Monitoring as Code - Managing your dashboards at scale
Gabriel Labachelerie
 50:06
50:06Single Server, Global Reach: Running a Worldwide Marketplace on Bare Metal in a Cloud-Dominated World
Jens Happe
 46:24
46:24The Rise of Reactive Microservices
David Leitner
 27:19
27:19Modularity: Let's dig deeper
Pratishtha Pandey
 28:30
28:30Empowering Developer Innovation - Balancing Speed, Security, and Scale
Amir Friedman, Martin Reynolds & Yair Etziony
 15:26
15:26New AI-Centric SDLC: Rethinking Software Development with Knowledge Graphs
Gregor Schumacher, Sujay Joshy & Marcel Gocke
 24:00
24:00Handling incidents collaboratively is like solving a rubix cube
Nele Uhlemann
 34:36
34:36Building Systems that Last
Werner Vogels
Related Articles
View all articles


From learning to earning
Jobs that call for the skills explored in this talk.


Grafana Labs
Remote
€109-131K
Senior
Go
Java
.NET
+5

Alexander Ash
Charing Cross, United Kingdom
£156-169K
Senior
Go
Linux
Python
Grafana
+1


Grafana Labs
Remote
€97-116K
Senior
Go
Java
Azure
+6

Schwarz Unternehmenskommunikation GmbH & Co. KG
Heilbronn, Germany
Senior
Go
Python
Grafana
Prometheus
Kubernetes