Liam Hurrell
All your telemetry data from any source in one place
#1about 6 minutes
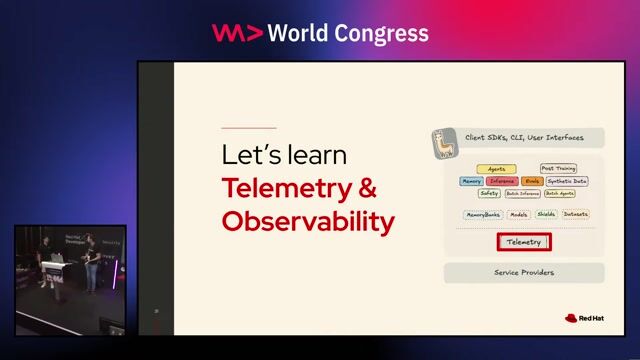
Understanding the core components of monitoring
Monitoring relies on three key pillars: metrics for performance data, dashboards for visualization, and alerts for proactive notifications.
#2about 3 minutes
Getting started with Prometheus and Grafana for monitoring
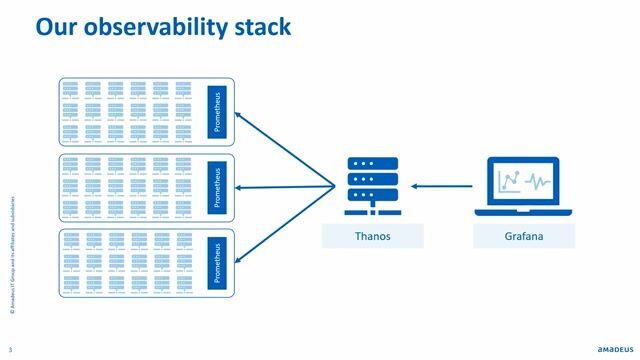
Prometheus provides a simple server solution for scraping and storing time-series metrics, which can then be visualized using Grafana dashboards.
#3about 6 minutes
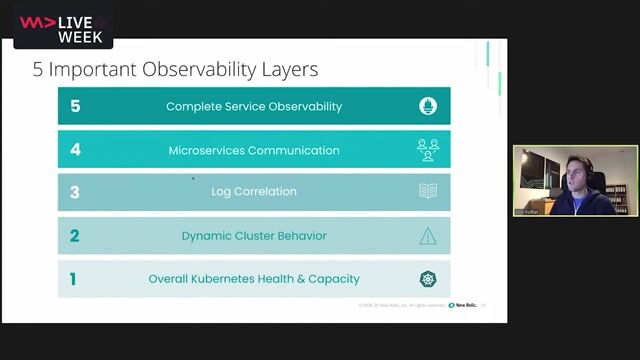
Moving from basic monitoring to full system observability
Modern complex systems require moving beyond just metrics to observability, which incorporates events, logs, and traces to understand system behavior and connect it to business KPIs.
#4about 6 minutes
Overcoming observability challenges with a unified platform
A unified, open telemetry platform helps solve common observability challenges like data silos, tool sprawl, and scalability by centralizing all data types in one place.
#5about 7 minutes
Integrating Prometheus using the remote write API
Use the Prometheus remote_write API to forward metric data to a centralized telemetry platform, allowing you to leverage its scale while keeping existing Grafana dashboards.
#6about 47 minutes
Hands-on lab for configuring Prometheus remote write
Follow a step-by-step lab to configure the Prometheus remote_write setting in a Kubernetes environment to send metrics to the New Relic platform.
#7about 21 minutes
Building custom dashboards by querying data with NRQL
Learn to use the SQL-like New Relic Query Language (NRQL) to explore different event types and build custom, interactive dashboards from your telemetry data.
#8about 8 minutes
Creating proactive alerts using NRQL queries
Use NRQL queries to define alert conditions and static thresholds, enabling you to get proactively notified when key performance indicators are breached.
#9about 13 minutes
Exploring platform benefits and further learning resources
Review the benefits of a SaaS telemetry platform, including its free tier, and discover additional resources like New Relic University to continue your learning journey.
Related jobs
Jobs that call for the skills explored in this talk.
Wilken GmbH
Ulm, Germany
Senior
Amazon Web Services (AWS)
Kubernetes
+1
Bonial International GmbH
Berlin, Germany
Senior
Python
Java
+1
Matching moments
10:40 MIN
Integrating Prometheus for complete service observability
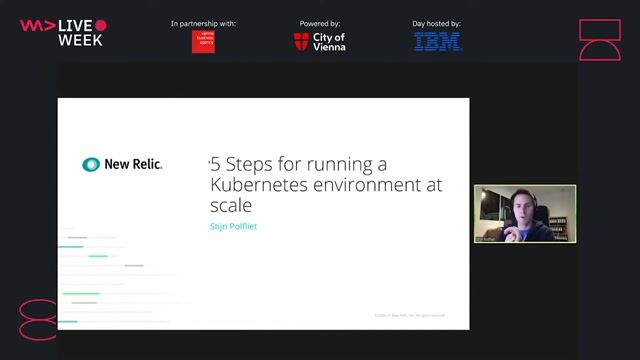
5 steps for running a Kubernetes environment at scale
01:49 MIN
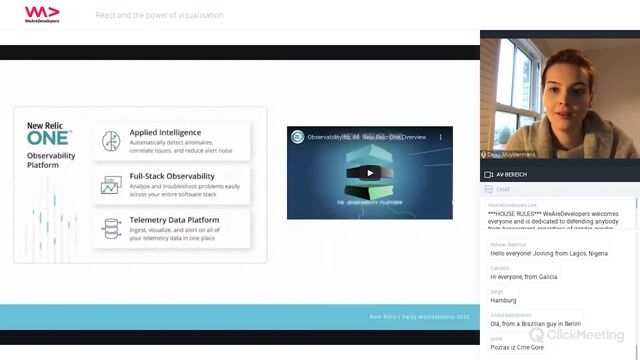
Understanding the New Relic One observability platform
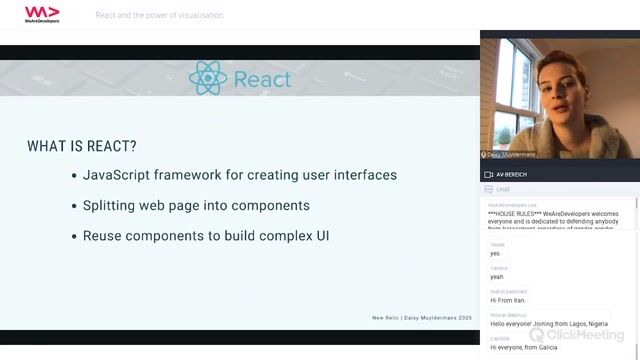
React and the power of visualisation
01:30 MIN
Observability, monitoring, and data management essentials
#90DaysOfDevOps - The DevOps Learning Journey
03:18 MIN
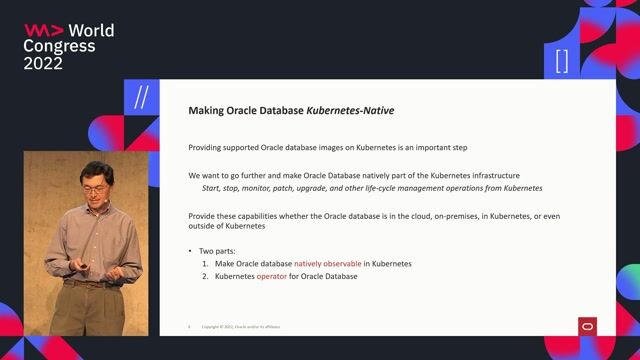
Achieving native database observability in Kubernetes
Kubernetes and Microservices with Multi-Model Databases
04:39 MIN
Monitoring applications with logs and metrics
Industrializing your Data Science capabilities
03:00 MIN
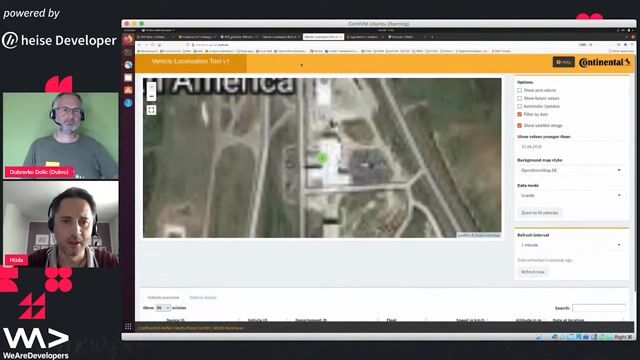
Gaining application observability with built-in telemetry
One AI API to Power Them All
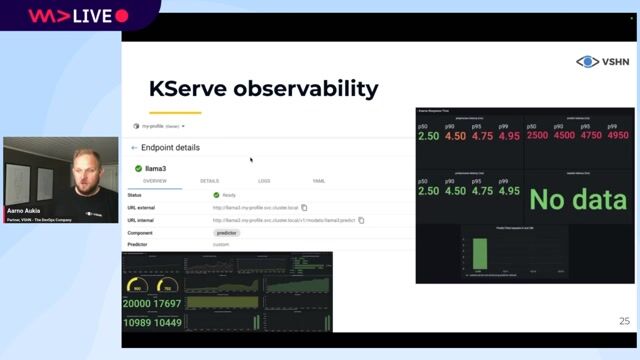
02:08 MIN
Monitoring LLM performance with KServe's observability tools
DevOps for AI: running LLMs in production with Kubernetes and KubeFlow
07:36 MIN
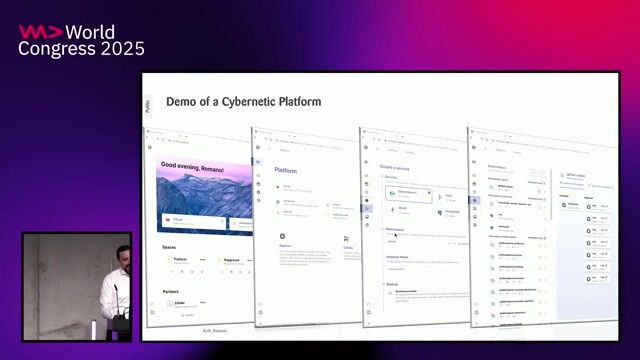
A live demonstration of an internal developer platform
AI-Augmented DevOps with Platform Engineering
Featured Partners
Related Videos
 53:57
53:57Hands on with OpenTelemetry
Nočnica Mellifera
 30:29
30:29Observability with OpenTelemetry & Elastic
Iulia Feroli
 1:27:59
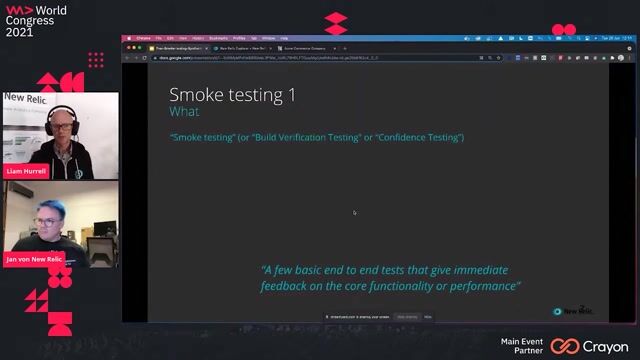
Proactive monitoring and smoke testing in your production environment
Liam Hurrel
 39:58
39:58Leverage Cloud Computing Benefits with Serverless Multi-Cloud ML
Linda Mohamed
 32:47
32:47Monitoring as Code - Managing your dashboards at scale
Gabriel Labachelerie
 40:19
40:19React and the power of visualisation
Daisy Muyldermans
 57:09
57:095 steps for running a Kubernetes environment at scale
Stijn Polfliet
 1:29:04
Implementing smoke testing and proactive monitoring in production
Liam Hurrell & Jan Kunzmann
Related Articles
View all articles


From learning to earning
Jobs that call for the skills explored in this talk.

Grafana Labs
Remote
£72-90K
C++
Python
Grafana
+2
Grafana Labs
Remote
£103-124K
iOS
Java
Kotlin
+3
Grafana Labs
Remote
iOS
Java
Kotlin
Flutter
+2
Grafana Labs
Remote
€109-131K
Senior
Go
Java
.NET
+5
Downforce Technologies
Bristol, United Kingdom
Intermediate
DevOps
Continuous Integration
Amazon Web Services (AWS)
Grafana Labs
Remote
€97-116K
Senior
Go
Java
Azure
+6
NEXT DIGITAL
Remote
Terraform
Continuous Integration
Amazon Web Services (AWS)
Scripting (Bash/Python/Go/Ruby)