Jérôme Vieilledent
Profiling Symfony & PHP apps with Blackfire
#1about 5 minutes
Why application performance is critical for business
Slow page loads directly impact revenue and conversion rates, making performance a critical business concern that should be addressed early in development.
#2about 5 minutes
How Blackfire profiles applications on-demand
Blackfire's on-demand profiler has minimal overhead in production because it only activates for authorized requests, unlike other tools like Xdebug.
#3about 6 minutes
Differentiating between monitoring and profiling
Monitoring and tracing identify when and where performance issues occur, while profiling provides deep insights into function calls to understand why they happen.
#4about 7 minutes
Profiling a Symfony app with the browser extension
The first step in debugging is running a profile using the browser extension and analyzing the timeline view to find slow code paths.
#5about 17 minutes
Analyzing the call graph to find bottlenecks
The call graph visualizes function interactions, using inclusive and exclusive time to highlight the critical path and pinpoint performance bottlenecks.
#6about 6 minutes
Fixing an N+1 query problem in Doctrine
An inefficient method that loaded all comments into memory was replaced with a repository method that performs a direct SQL COUNT query.
#7about 7 minutes
Comparing profiles to validate performance fixes
Use the profile comparison feature to get objective data on the impact of code changes across dimensions like wall time, CPU, and memory.
#8about 14 minutes
Using recommendations to optimize PHP and Symfony
Blackfire's built-in recommendations help identify and fix common configuration issues related to PHP, OPcache, Composer autoloading, and framework settings.
#9about 12 minutes
Implementing caching to reduce database queries
Adding a cache layer for frequently calculated data significantly reduces the number of SQL queries and improves response time.
#10about 16 minutes
Automating performance testing with scenarios
Define performance tests and user scenarios in a .blackfire.yaml file to automate checks in CI/CD pipelines and prevent regressions.
#11about 7 minutes
An overview of Blackfire's monitoring features
Monitoring provides a high-level view of application health, tracks key transactions, and can automatically trigger detailed profiles when issues are detected.
Related jobs
Jobs that call for the skills explored in this talk.
Bonial International GmbH
Berlin, Germany
Senior
Python
Java
Matching moments
01:34 MIN
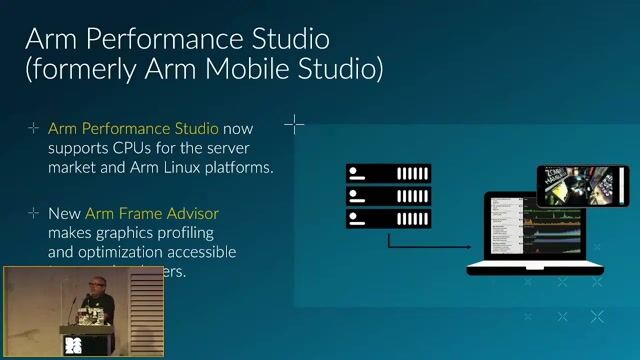
Profiling and optimizing workloads with Arm Performance Studio
Unleashing the Full Potential of the Arm Architecture – Write Once, Deploy Anywhere

06:13 MIN
Navigating the complexity of performance debugging tools
WeAreDevelopers LIVE - Rendering in the Browser, The State of CSS and Accessibility and more
01:26 MIN
Introducing a workshop on better testing practices
Why Testing Matters in AI - Luise Freese and Elio Struyf
02:29 MIN
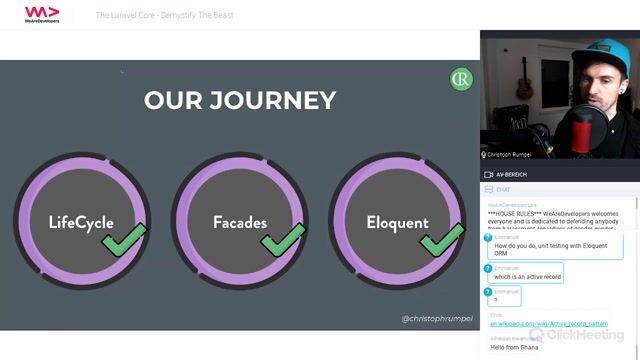
Mastering your tools to become a better developer
The Laravel Core - Demystify The Beast

02:36 MIN
Showcasing the live deployed app and production examples
Build and Deploy a Fullstack App with Open Source Tooling

02:27 MIN
Using forensic psychology to analyze your codebase
Your Code as a Crime Scene
09:16 MIN
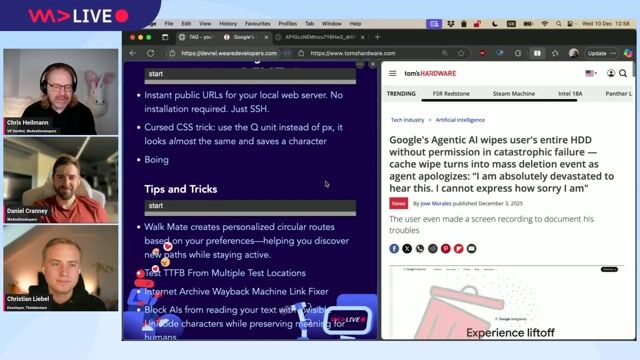
Useful developer tools for local sharing and performance analysis
WeAreDevelopers LIVE – Guten TAG, Web Standards, AI and more
03:15 MIN
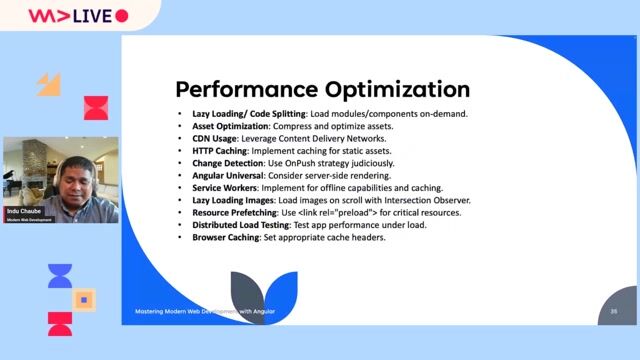
Applying key performance optimization techniques
Angular Unleashed: Mastering Modern Web Development with Angular
Featured Partners
Related Videos
 1:27:59
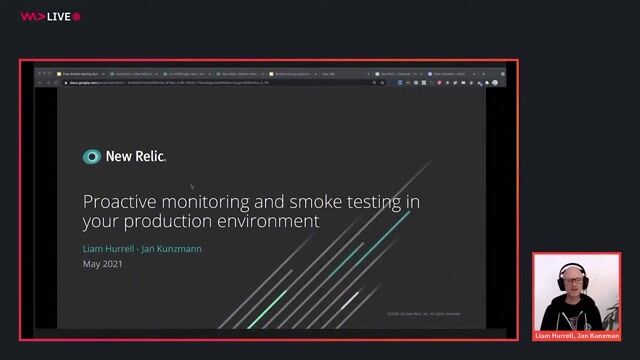
Proactive monitoring and smoke testing in your production environment
Liam Hurrel
 1:29:04
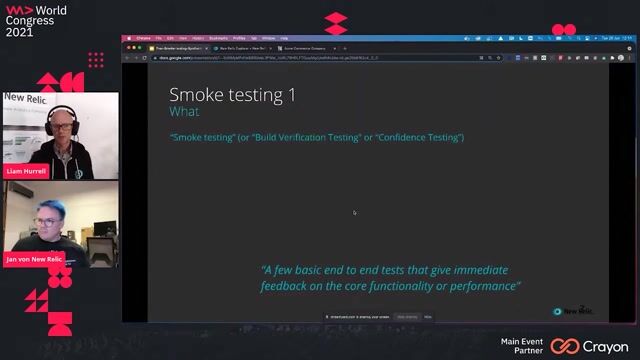
Implementing smoke testing and proactive monitoring in production
Liam Hurrell & Jan Kunzmann
 36:50
36:50Frontend Performance Testing in practice
Jonas Kröger
 57:45
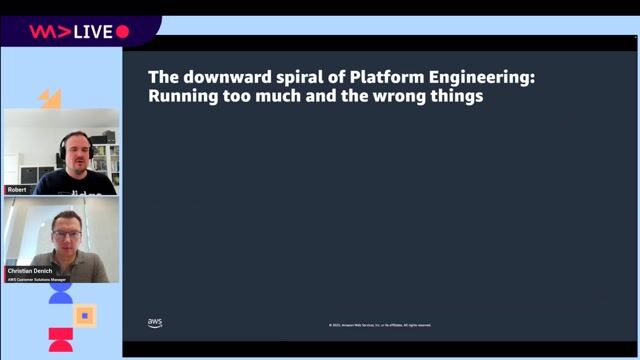
57:45Forget Developer Platforms, Think Developer Productivity!
Robert Hoffmann & Christian Denich
 40:24
40:24Snappy UI needs no Single-Page Application
Clemens Helm
 2:08:06
The attacker's footprint
Antonio de Mello & Amine Abed
 59:03
59:03Multiple Ships to the Island - Micro Frontends & Island Architectures
Florian Rappl
 27:27
27:27Things I learned while writing high-performance JavaScript applications
Michele Riva
Related Articles
View all articles


From learning to earning
Jobs that call for the skills explored in this talk.

Sebastian Frankeintercon Solutions Gmbhwir
Mainz, Germany
€50-90K
PHP
API
GIT
Perl
+6
Multiplied
Utrecht, Netherlands
€6K
PHP
Unix
MySQL
DevOps
+6
Edtech France
Canton de Nantes-1, France
Senior
API
GIT
Twig
DevOps
Docker
+5