Johanna Schmidt
Web-based Information Visualization
#1about 8 minutes
Why information visualization is essential for data analysis
Visualizing data is crucial because humans interpret images better than numbers, as demonstrated by Anscombe's Quartet where identical statistics hide vastly different datasets.
#2about 6 minutes
The process of mapping data to visual attributes
Data mapping is the core process of converting data attributes into visual representations like position, size, shape, and color to create effective charts.
#3about 4 minutes
A survey of visualization tools and libraries
An overview of the visualization landscape covers fully-featured applications like Tableau and Power BI, as well as programming libraries for Python, R, and JavaScript.
#4about 6 minutes
Using SVG and Canvas for web visualizations
Web-based visualizations are primarily built using SVG for its vector graphics and native interactivity, while Canvas offers more complex drawing capabilities with WebGL.
#5about 4 minutes
A closer look at the D3.js library
D3.js is a powerful and flexible open-source JavaScript library that binds data to DOM elements, enabling a wide range of custom and interactive visualizations.
#6about 10 minutes
Choosing tools for analysis versus presentation
Data visualization serves different use cases like exploration and presentation, and a comparative study shows how tools like D3.js excel at flexible presentation.
#7about 5 minutes
Overcoming challenges of data size and security
Web-based visualizations must address performance issues with large datasets through aggregation and sampling, and handle the security implications of client-side data transfer.
#8about 1 minute
Key takeaways for effective web-based visualization
To succeed with web-based visualization, it is crucial to know your users and use case, carefully select the data to be shown, and leverage open-source libraries.
Related jobs
Jobs that call for the skills explored in this talk.
Matching moments

05:59 MIN
Introducing SciChart for high-performance data visualization
WeAreDevelopers LIVE – From JavaScript to WebAssembly, High-Performance Charting and More
04:19 MIN
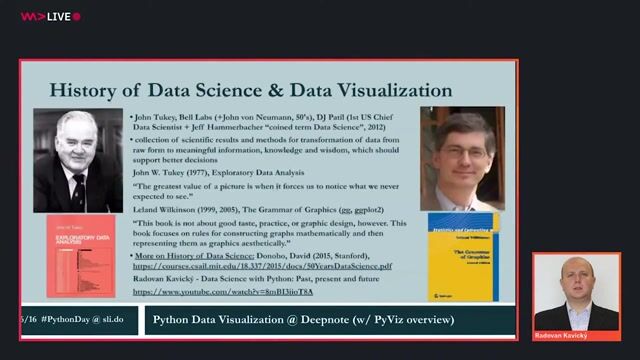
The theoretical foundations of modern data visualization
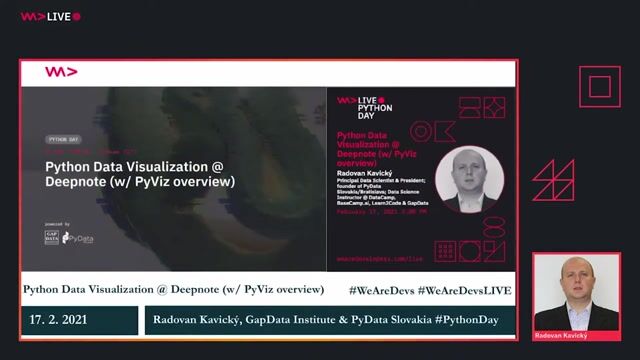
Python Data Visualization @ Deepnote (w/ PyViz overview)

02:29 MIN
Introducing a high-performance charting library for the web
Uncharted Territories of Web Performance - Andrew Burnett-Thompson and David Burleigh

05:09 MIN
Exploring high-stakes use cases for performance charting
Uncharted Territories of Web Performance - Andrew Burnett-Thompson and David Burleigh

03:01 MIN
An overview of the 2021 web developer survey
Web development best practices in 2021

05:07 MIN
The World Wide Web era of scalability and design
Closing Keynote by Joel Spolsky

01:57 MIN
A call to challenge your web performance assumptions
Uncharted Territories of Web Performance - Andrew Burnett-Thompson and David Burleigh
08:03 MIN
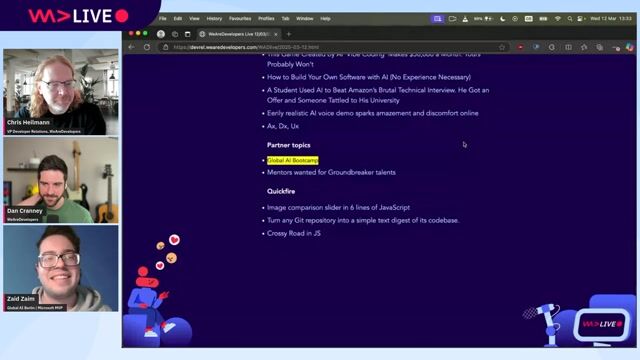
Exploring modern tools for web interaction and analysis
WeAreDevelopers LIVE - the weekly developer show with Chris Heilmann and Daniel Cranney
Featured Partners
Related Videos
 50:38
50:38Python Data Visualization @ Deepnote (w/ PyViz overview)
Radovan Kavický
 49:57
49:57Uncharted Territories of Web Performance - Andrew Burnett-Thompson and David Burleigh
Andrew Burnett-Thompson & David Burleigh
 43:20
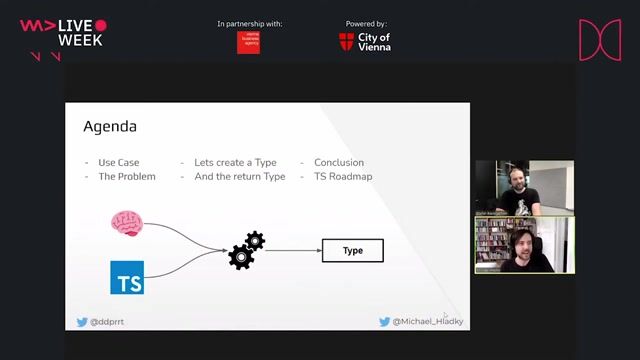
43:20The Art and Craft of Type Development
Michael Hladky & Stefan Baumgartner
 1:09:56
WeAreDevelopers LIVE – From JavaScript to WebAssembly, High-Performance Charting and More
Chris Heilmann, Daniel Cranney & Andrew Burnett-Thompson and David Burleigh
 34:34
34:34Vision for Websites: Training Your Frontend to See
Daniel Madalitso Phiri
 51:10
51:10Web development best practices in 2021
Laurie Voss
 40:19
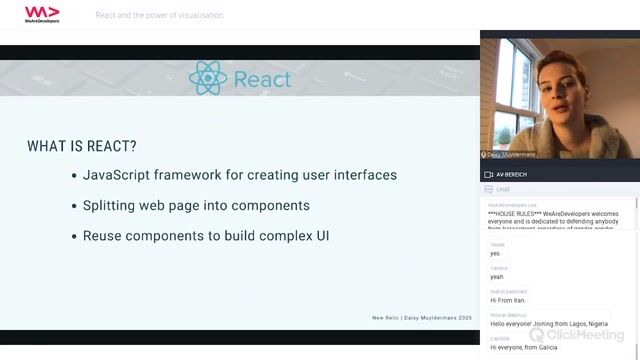
40:19React and the power of visualisation
Daisy Muyldermans
 14:44
14:44Catching up on the basics you don't really need that much code
Chris Heilmann
Related Articles
View all articles


.gif?w=240&auto=compress,format)
From learning to earning
Jobs that call for the skills explored in this talk.

&why GmbH
Berlin, Germany
€50-70K
Junior
Intermediate
Senior
React
Next.js
TypeScript

Bright Purple Resourcing Ltd
Edinburgh, United Kingdom
Remote
£95K
Senior
Python
Splunk
Grafana
+1
Grey Matter Recruitment
Charing Cross, United Kingdom
Remote
£160-200K
Senior
React
JavaScript
TypeScript
+2
Barcelona Supercomputing Center
Barcelona, Spain
Junior
C++
Python
Machine Learning
Ss&c Technologies, Inc.
Charing Cross, United Kingdom
Remote
£65-85K
Senior
CSS
HTML
Linux
+9
Espritek
Canton of Ivry-sur-Seine, France